ADABTC is being shilled nowadays as a coin that can repeat EOS style 2018 Pump when it posted 600% gains. Let’s have a look & see if ADABTC has the Whales Power to actually get there.
Let’s start with checking the Whale (Large Investors) Activities since inception.

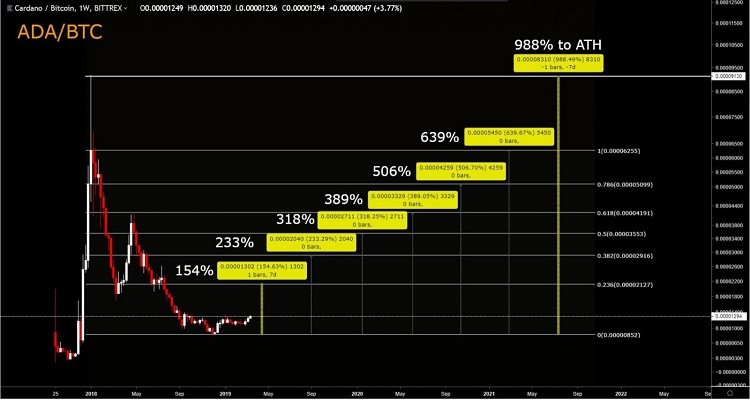
ADABTC has witnessed 4 Major Pumps since its inception. The first one was during the 2017 Bull run when it posted 3134% Gains. After the Pullback in 2018, ADA witnessed a 148% Follow Up Pump. Since then ADA managed to post 42% once and 56% recently. The Price Action in the current area is rather strong. However, there is a strong Horizontal Resistance coming up, which must be overcome before any meaningful upside. Looking at the Whale Activity Chart. we can assume, the Whales are fairly active in ADA. That’s a Plus from the perspective of liquidity & market influence. Now, let’s check the chart to understand, how much ADA needs to pump in order to get to 23.6%, 38.2%, 50% as well as 61.8% & 78.6%.

ADA needs to post 154% gains from the bottom to reach 23.6% Fib Level, assuming we draw the fib on a closing candle in a weekly chart. While 233% gains are required to attain 38.2% Levels. On the top end, ADA needs to post 988% Gains just to Reach All-Time High again. Can ADA do it? Well, for now, it’s stuck against a Local Resistance. Let’s go and check the next chart to understand that.

As we can see there is a Horizontal Resistance coming up and ADA might want to take some breather & trade softer, before breaking out or breaking down. Let’s Zoom that area and see how it looks.

Draw this Resistance Zone on your Chart. As long as we hold this Resistance, Expect a Pullback towards 200 Day MA which is acting as support currently. Plus there is an up-trend-line coming up. I would like to position myself to buy somewhere around that. However, I am also open to BUY the upside break. Of course, those who are trading at Bitmex will be trading both Buy Support and Sell against Resistance. But I am focusing on BUY Side as far as Binance is concerned.
ADABTC – My VERDICT: I Will wait to buy on a Pullback after the Upside Break above 1350 Seats or will consider buying the Dips towards the 200 Day MA & Up-trend Line.
If you like this analysis, do write your comments below to encourage us to write more. You also can check the ZECUSD analysis.
Don’t forget to check our Youtube Channel for educational videos.
And follow us on Twitter for regular updates.
Legal Disclaimer: All Information & Technical Analysis Modules are based on Proven Tech Analysis methods and strategies. However, as always do your own research before taking any trading positions based on any online or social media posts including ours.
Excellent analysis as always!
Thank you Daniel
Very good analysis and so easy to understand for a noobs like me. Thanks
Best analysis of past present future of a coin I’ve seen in the 14 months of bear market.
Easy or understandably for noobs + educational and leaves no room for experts to weigh in with their egos.
Excellent, learning so much ! Thanks
En nombre de todos los que leyeron este análisis y no dejaron ningún comentario:
Gracias.
Wow…Thanks a bunch.
Great Chart. Simple and Clear chart for the newbie who can understand the S/R and basic FIb Levels. Awesome Work Sir… Please do post charts regularly …
TY for great analysis and a solid buy guide
Amazing analysis like all of your ideas 🙂
I truly enjoyed the reading!
Awesome work. Please continue
I enjoy ur work and look forward to more of it
Adroit one!
really good analysis wow
Now that ADA/BTC has fallen below the 200 day MA, is it a good time to buy? You mentioned above that you would consider buying the dips towards 200 day MA, but we’re well beneath it now. Even better time to buy this low?
Great analysis as always…much appreciated.😀
Im glad i’ve been learning a lot from you. Im using brave explorer so, all my $bat im using to tipping you each time i ge them. Keep improving