Bitcoin continued to trade sideways during the week of 11-17 March. Registered the Lowest Low of 3811 & highest high of 4057 at Binance. Currently trading around 4000 Mark. CBOE announced the suspension of the Bitcoin Futures contract from June 2019, which was deemed positive by many analysts considering, the introduction of futures in December 2017 triggered the 2018 bear Market. Apart from that nothing much to cheer on the fundamental side with no BAKKT or ETF in the site yet.
Last Week’s Bitcoin Price Action:
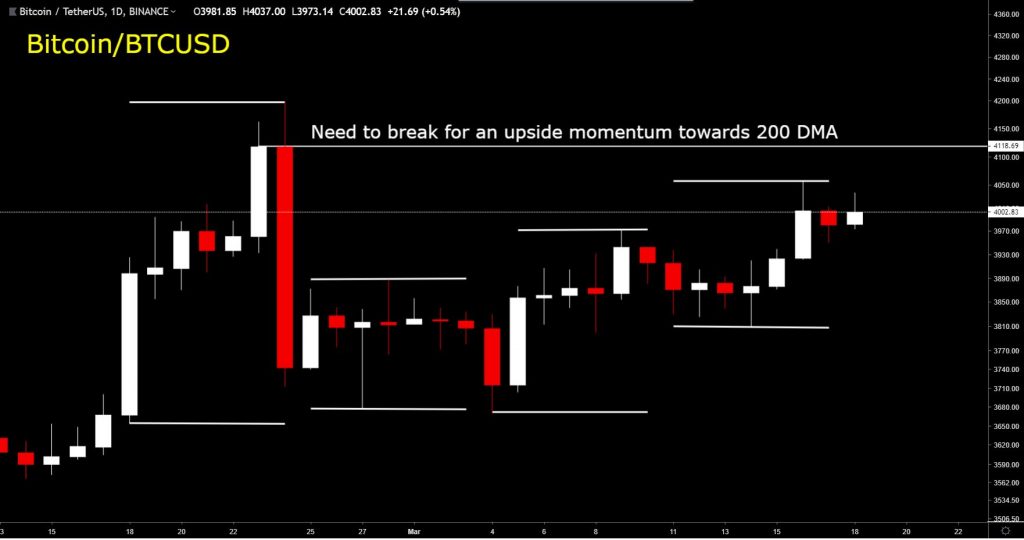
Looking at the Bigger Picture in 3 days, we are stuck against a Major Horizontal Resistance around 4047 @ Binance. We need to break this resistance for the bullish momentum to continue. Any Major Rejection from here will eye the horizontal support at 3722 followed by the up-trend line. Confirmed breakout will lead us to 200 DMA area initially that currently resides around 4800 Area and moving down
3 Days Bitcoin Chart:
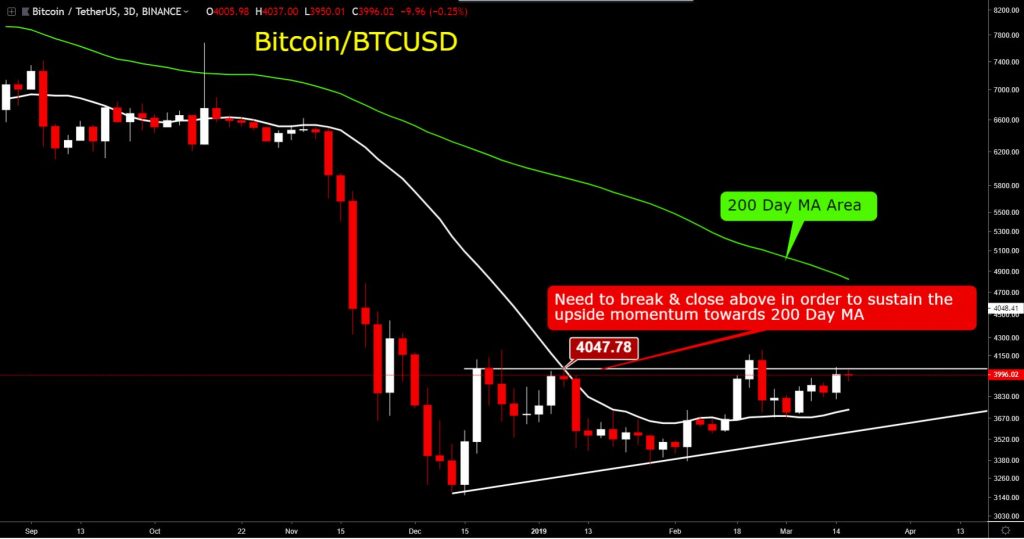
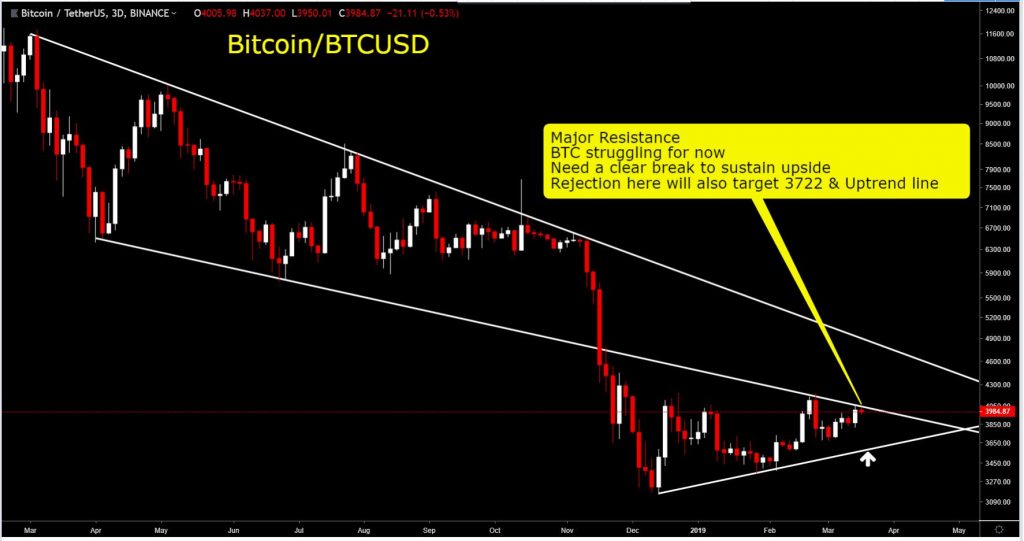
Bit Longer view of the 3 Days chart indicates, there is down-trend support turned resistance line that is halting the advances for Bitcoin price at the moment. The Trend-line is significant in the sense that it held earlier too. All in all the 4000-4150 Area offers an interesting setup for bears to retest 3722 & up-trend line. On the other side, this is also a perfect level for bulls to break & show their might. Looks like neither of them will give it up easily. Let’s wait for a clear break of 4050 (Binance) in the Daily chart for the resumption of upside momentum. Buying Dips towards 3722 & up-trend line will yield some quick scalping profits.
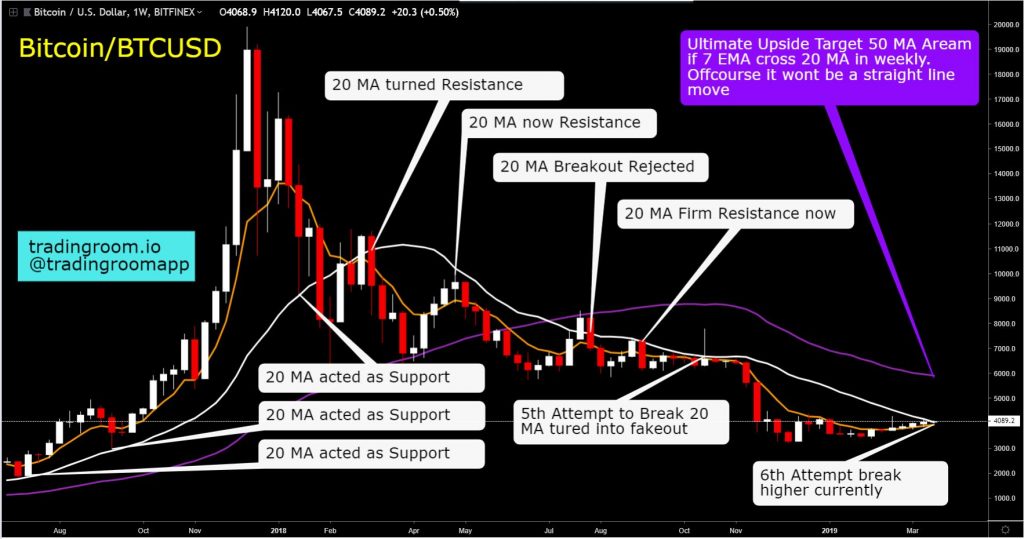
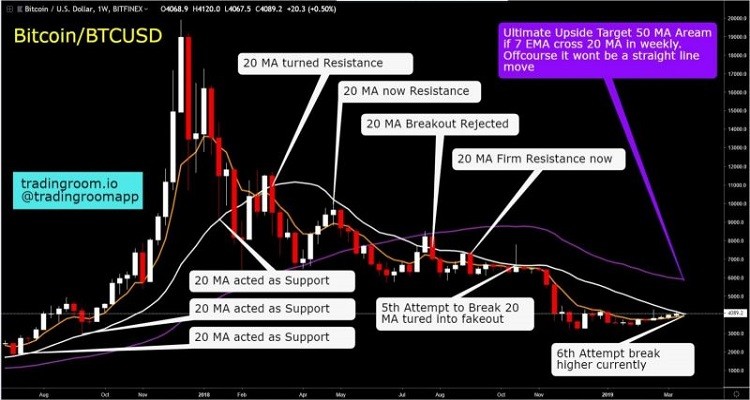
 Now let’s check the mother of all resistance. 20 Simple MA in Weekly Chart is acting like a stubborn resistance since the downside break in Feb 2018. Price has tested 20 Weekly MA 5 times since then & has rejected every time since then & posted new Lows after almost every attempt. Price currently testing 20 Weekly MA again. Two things to note, a rejection from here may hold 3722 & 3580 Binance Levels. If that happens, we will most likely break 20 MA on the upside on the 7th / 8th Attempt. Another scenario is an absolutely tight range between 7 Weekly EMA and 20 Weekly MA for a few more days before a decisive move. Only a confirmed break above will open up 200 Day MA around 4800 as the next target
Check this Mother of all Resistance BTCUSD Chart:
Key Bitcoin Levels as of today, Remember all these Levels are moving & will move further
5951 350 MA Daily – Moving Down
4856 200 MA daily – Moving down
4724 Monthly Horizontal Resistance – Static
4077 Down Trend Line – Moving Down
4050 Horizontal Resistance – Static
3982 20 Weekly MA – Moving Down
3973 Current Price
3874 20 MA Daily – Moving Sideways
3738 50 MA Daily – Moving Up
3696 100 MA Daily – Moving Sideways
3547 Up-Trend Line – Moving Up
On the Daily BTCUSD Chart, 50 MA has crossed over above 100 MA for the first time since August.
As long as Price holds 100 MA Area, Expect an attempt to break above 20 weekly MA
All in all this week can go sideways with bearish retests above 50 MA before an attempt to break & close above 20 Weekly MA
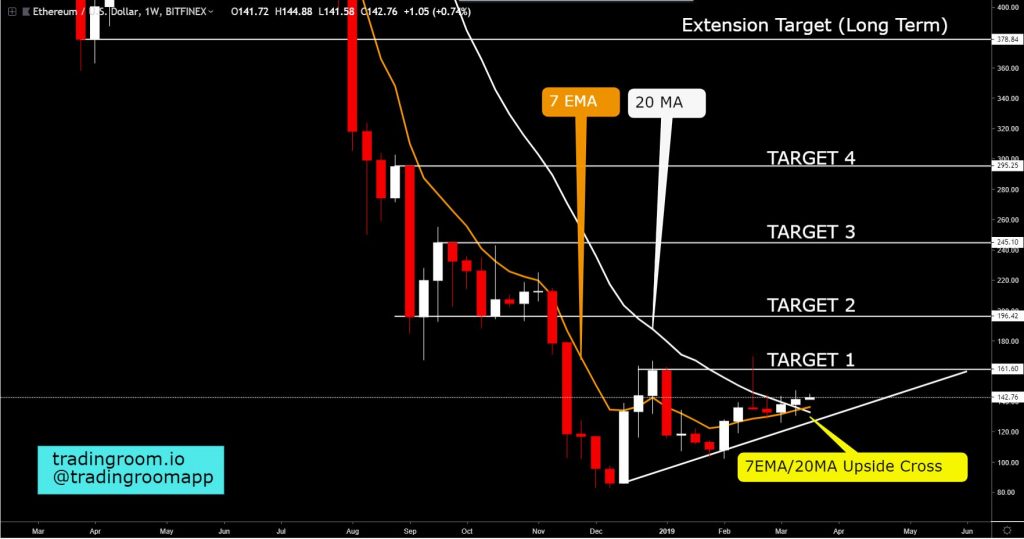
And to give you some hopes, let’s look at Ethereum where 7 Weekly EMA already crossed 20 Weekly MA. Hoping for some fireworks soon towards 160 Area first. Only a confirmed break above 200 DMA will target 190-200 Area
If you like this analysis, do write your comments below to encourage us to write more
Don’t forget to check our Youtube Channel for educational Videos
And follow us on Twitter for regular updates

Thanks for your efforts
Thanks again for the insight ! Keep up the good work ! Much appreciated !
Fantastic summary and absolutely loving everything you are providing to the crypto community.
Very helpful as always! Keep it up!
Very helpful as always! Keep it up!
Brilliant, in depth analysis 👌👍👏👏. Really appreciate the efforts. Thank you.
Great analysis as always Sir. Pointed some very important things I wasn’t paying attention to. Thanks for all that you do!
Thank you Tradingroomapp, easy to understand and very informative. Great to see key levels laid out on a simple to understand chart. Keep up the great work
Beautifull analysis
Thanks this is very helpfull
Thank you very much …. a real help in learning the base of trading..
Thank you very much. Really appreciate all your insights and information.
Great post love your content and the trading app, if you could do me a favor and check out my last tweet. @ifaughtjim. Let me know what you think? Thanks!
Awesome analysis. This is only source that I consider legit. Keep up the good work.
Thanks for providing such great content and tools ! I’ve been following since the very beginning of Trading Room and you have been truly a great great inspiration !
Thanks for providing such great content and tools ! I’ve been following since the very beginning of Trading Room and you have been truly a great great inspiration !
many thanks for the beatiful analysis
Excellent post with a lot of in-depth useful information.
Top notch as usual @tradingroomapp !
Thank you very much, your insight is greatly appreciated!
Great article!
One question: it seems 100 Daily EMA is acting as a stubborn resistance as well. Why is there no mention of the 100 Daily EMA?
I always watch your opinion about crypto & compare to the other your articles have a deep analysis and also complex scenarios, I like it and really helpful.. Keep a good work buddy 👍
So shall we buy or sell sir? What to do?
😁